From scammers and all sorts of "predictors" of market behavior, we can often hear about the use of technical analysis of charts of the value of securities. Nevertheless, the tarnished reputation of the instrument of financiers and brokers is far from a reason to abandon its use. Especially when you consider that the investor community has been working on something like this for many years.
Yes, of course, no one will give you a 100% guarantee even with correct and competent analysis, but there are never categorical forecasts on the stock exchange, so let's understand.
What is the essence of technical analysis?
Roughly speaking, technical analysis is used to assess the market opportunities at the moment, based on objective, not subjective indicators, which is impossible with the usual "human" analysis of a particular situation.
Thus, the fundamental indicator, in technical analysis, is the price in a specific time period, which is practically the only possible objective indicator of the market, its interest in a particular security and much more. At the same time, the emotional component does not play almost any role, or rather should not play.
This is especially important, intuition in such calculations is your enemy. You should only look at the numbers and their graphical embodiment.
What are the main tools of technical analysis?
The main tools of technical analysis are the support and resistance levels. For example, if the chart shows that the share price several times showed a rapid fall, but stopped it at around $ 100, then this is a classic support level and vice versa.
Also, often the support and resistance levels are called the lows and highs of charts for a long period of a quarter, a year or more.
Main types of technical analysis
Among the main types of technical analysis are the classical model, Elliot wave analysis and candlestick analysis.
In the first case, pay attention to established figures, the so-called patterns, including a variety of triangles, pennants, falling knives and so on.
According to the second type of technical analysis, the main element is 8 Elliot waves, five of which contribute to the trend, and three - on the contrary oppose.
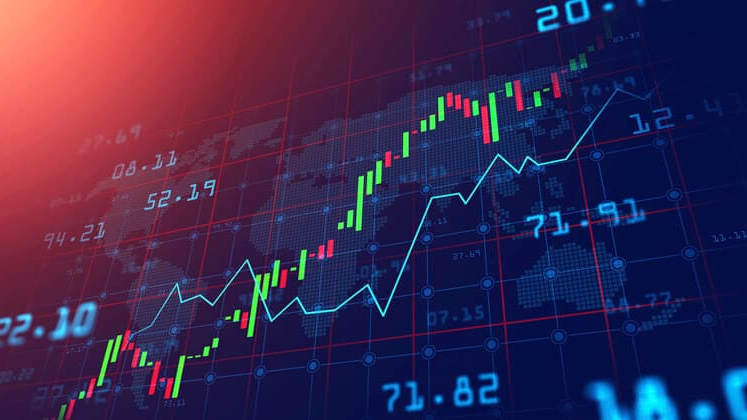
The latter type involves the use of not a classic linear chart, but the so-called candlestick, in which the upper and lower "wick" is the maximum and minimum cost for a certain period, and the upper and lower boundary of the "candle body" is the price of opening and closing the period.